Businesses. Workers. Investors. The government. Everyone uses the unemployment rate to measure how well the economy is doing. You might keep an eye on the national rate, but what about unemployment rates by state?
Read on to learn the unemployment rate per state and why it matters. And, find out what the U.S. unemployment rate is.
What is the unemployment rate?
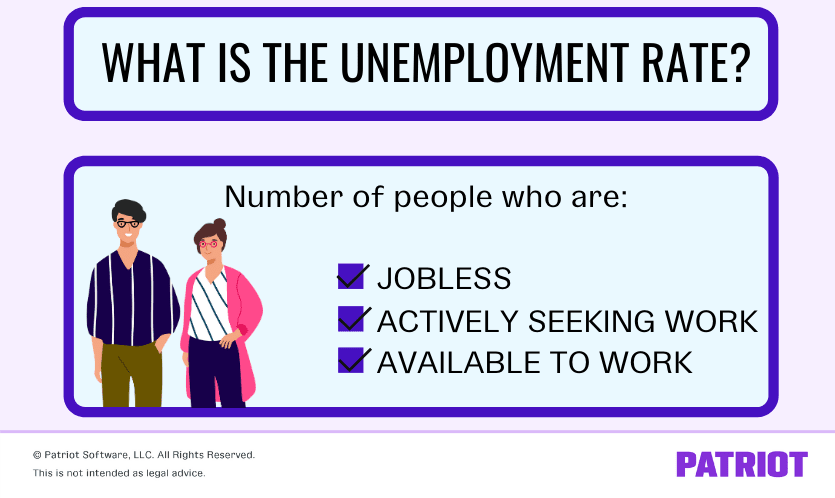
The Bureau of Labor Statistics (BLS) defines unemployment as the number of people who are jobless, actively seeking work, and available to work. The unemployment rate shows the number of unemployed individuals as a percentage of the entire labor force (which counts both the employed and unemployed).

The unemployment rate goes beyond the number of individuals receiving unemployment benefits. In fact, only about one-third of unemployed individuals receive unemployment benefits, according to the BLS. To get a more accurate count, the government conducts a monthly survey: the Current Population Survey (CPS).
Here’s the bottom line: The unemployment rate is not the same number of people who receive unemployment benefits. However, it still is a factor in state unemployment tax rate ranges, which we’ll get to next.
Why the state-by-state unemployment rate matters
So, what does the unemployment rate have to do with business? Besides being a central focus on the news, you may want to know how the unemployment rate impacts your business.
Unemployment rates by state could affect:
- SUTA (State Unemployment Tax Act) tax rate ranges
- Talent pool
- Business profits
- Employee morale
- Unemployment benefits
1. SUTA tax rate ranges
Employers are responsible for paying federal and state unemployment taxes for their employees. That way, your employees can apply for unemployment benefits if you have to lay them off.
Most states assign a standard new employer SUTA tax rate for new employers. After some time (typically a year), the state assigns employers an individual SUTA tax rate, which falls within a set contribution rate range. This rate varies by employer and depends on factors such as:
- Industry
- How many former employees received unemployment benefits
- Experience
So, how do states arrive at the contribution rate ranges? Cue economic conditions and filed unemployment claims. Many states have varying tax schedules, which determine the minimum and maximum contribution rates.
The schedule a state uses in a given year depends on how the state is doing economically. And, remember what is one of the biggest economic indicators? That’s right: the unemployment rate.
Although your individual SUTA tax rate is specific to your business, the range it falls in is based on the economy.
2. Talent pool
The unemployment rate also impacts your available talent pool for hiring. And, it could affect your ability to retain employees.
Typically, the higher the unemployment rate, the easier it is to find job-seeking workers. And the lower the unemployment rate, the harder it could be to find talent.
Likewise, you could have a more challenging time with retaining employees when unemployment is low. During this time, workers have more job options, which may cause them to job hop. According to one survey, low unemployment rates created this job-hopping trend.
So when unemployment rises, you may notice employees planting down roots more so than during low unemployment.
Keep in mind that your ability to hire and retain employees doesn’t depend solely on how the economy is doing. There are a number of ways you can keep employee retention high in the age of low unemployment. Not to mention, your employees may still be set on leaving even if unemployment is high.
3. Business profits
Unemployment rates by state may also impact your business’s profits. When unemployment is low, purchasing power is high. And when unemployment is high, purchasing power is low.
Individuals who are out of a job likely aren’t apt to spend as much at their favorite business, which could result in you seeing lower profits.
According to past data from the BLS, the Consumer Price Index (CPI) drops when unemployment rate increases. Many consumers use the CPI to determine whether they should spend or save their money, as it indicates inflation or deflation. Negative CPI can indicate deflation, which may be the result of a decreased demand for goods.
Take a look at the relationship between unemployment and CPI, according to the BLS:
| April 2020 | May 2020 | June 2020 | |
| Unemployment Rate | 14.7% | 13.3% | 11.1% |
| Consumer Price Index | -0.8% | -0.1% | 0.6% |
As you can see, the CPI indicates deflation in April. As the unemployment rate fell in May and June, the CPI began to increase.
4. Unemployment benefits
The more widespread unemployment is, the more involved the government might get in issuing relief for those without work.
Generally, unemployment benefits are a percentage of what a claimant made while they were working. And, the state normally limits benefits to individuals who meet certain criteria.
But when the unemployment rate is high, the state might give unemployment benefits a boost and waive certain requirements.
For example, federal and state governments implemented a number of changes to strengthen unemployment benefits during COVID-19 under the CARES Act, such as:
- Waiving the requirement that unemployment applicants must actively search for other work or wait before applying for unemployment
- Extending unemployment to individuals who don’t typically qualify, such as those who are self-employed, LLC or S Corp owners, independent contractors, and gig workers
- Increasing unemployment benefit amounts (e.g., there was an additional $600 per week from March through July 2020)
Unemployment rates by state
When COVID-19 began spreading around the U.S., unemployment skyrocketed. At its highest in 2020 (April), the national rate was at 14.7%, according to the BLS.
The current unemployment rate (national), as of September 2020, is 7.9%. So, what was the state with highest unemployment rate? What was the state with lowest unemployment rate?
According to the BLS, the five states with highest unemployment in September 2020 include:
- Hawaii
- Nevada
- California
- Rhode Island
- Illinois
And, the five states with lowest unemployment are:
- Nebraska
- South Dakota
- Vermont
- North Dakota
- Iowa
Take a look at the BLS unemployment monthly rate by state to see how your state compares:
| State | Unemployment Rate (September 2020) |
| Alabama | 6.6% |
| Alaska | 7.2% |
| Arizona | 6.7% |
| Arkansas | 7.3% |
| California | 11.0% |
| Colorado | 6.4% |
| Connecticut | 7.8% |
| Delaware | 8.2% |
| D.C. | 8.7% |
| Florida | 7.6% |
| Georgia | 6.4% |
| Hawaii | 15.1% |
| Idaho | 6.1% |
| Illinois | 10.2% |
| Indiana | 6.2% |
| Iowa | 4.7% |
| Kansas | 5.9% |
| Kentucky | 5.6% |
| Louisiana | 8.1% |
| Maine | 6.1% |
| Maryland | 7.2% |
| Massachusetts | 9.6% |
| Michigan | 8.5% |
| Minnesota | 6.0% |
| Mississippi | 7.1% |
| Missouri | 4.9% |
| Montana | 5.3% |
| Nebraska | 3.5% |
| Nevada | 12.6% |
| New Hampshire | 6.0% |
| New Jersey | 6.7% |
| New Mexico | 9.4% |
| New York | 9.7% |
| North Carolina | 7.3% |
| North Dakota | 4.4% |
| Ohio | 8.4% |
| Oklahoma | 5.3% |
| Oregon | 8.0% |
| Pennsylvania | 8.1% |
| Rhode Island | 10.5% |
| South Carolina | 5.1% |
| South Dakota | 4.1% |
| Tennessee | 6.3% |
| Texas | 8.3% |
| Utah | 5.0% |
| Vermont | 4.2% |
| Virginia | 6.2% |
| Washington | 7.8% |
| West Virginia | 8.6% |
| Wisconsin | 5.4% |
| Wyoming | 6.1% |
Looking for an easier way to run payroll? Patriot’s payroll software has you covered with its simple three-step process. Plus, get free, USA-based support, setup, and so much more. Start your trial today!
This is not intended as legal advice; for more information, please click here.


